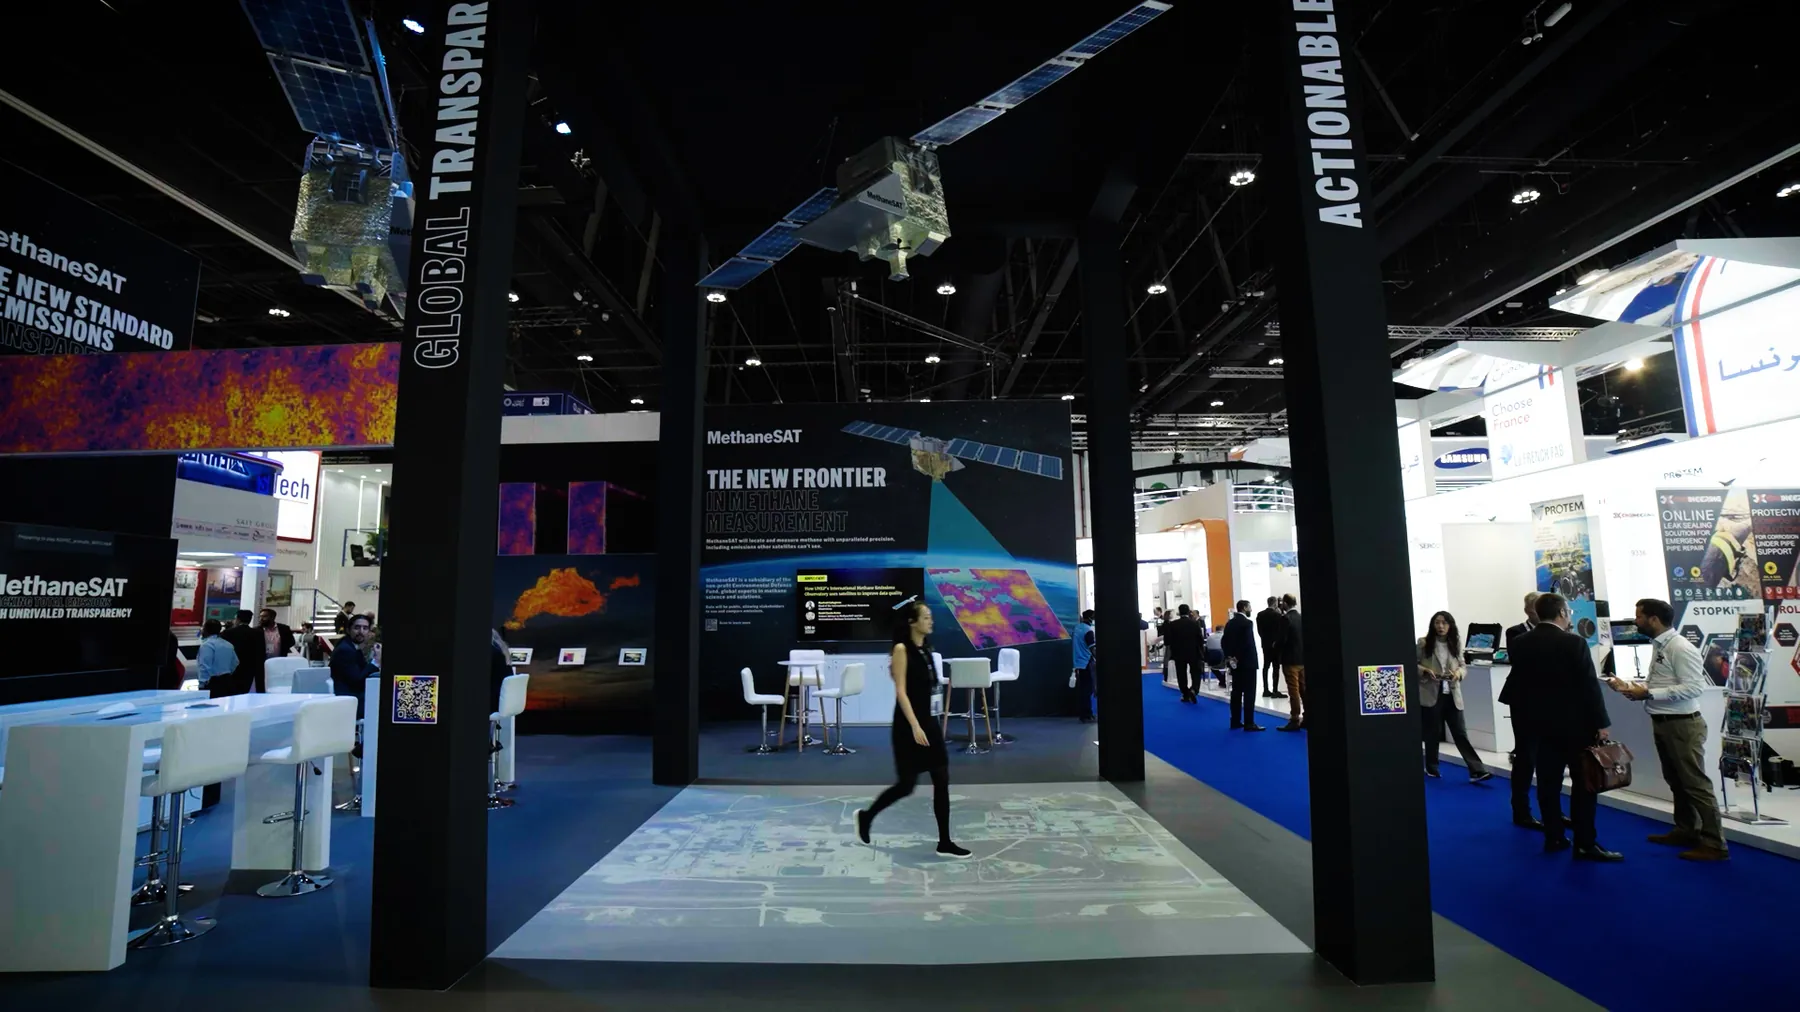
Story A
Basin totals
The whole region at once: how much methane an entire production basin is releasing.
MethaneSAT · Live Events · WGC Beijing 2025
A projection-mapped, iPad-guided table that let Environmental Defense Fund show the global gas industry what satellite methane data actually reveals. Bilingual in English and Mandarin, built to travel, and premiered at WGC 2025.
01 · The challenge
EDF needed to make MethaneSAT’s emissions data useful to the people who run the gas industry: engineers, operators and executives walking a crowded trade-show floor in Beijing.
The brief asked for something engaging enough to stop them, credible enough to earn trust in Asian markets, fluent in English and Mandarin, and portable enough to live on after the show.
02 · The idea
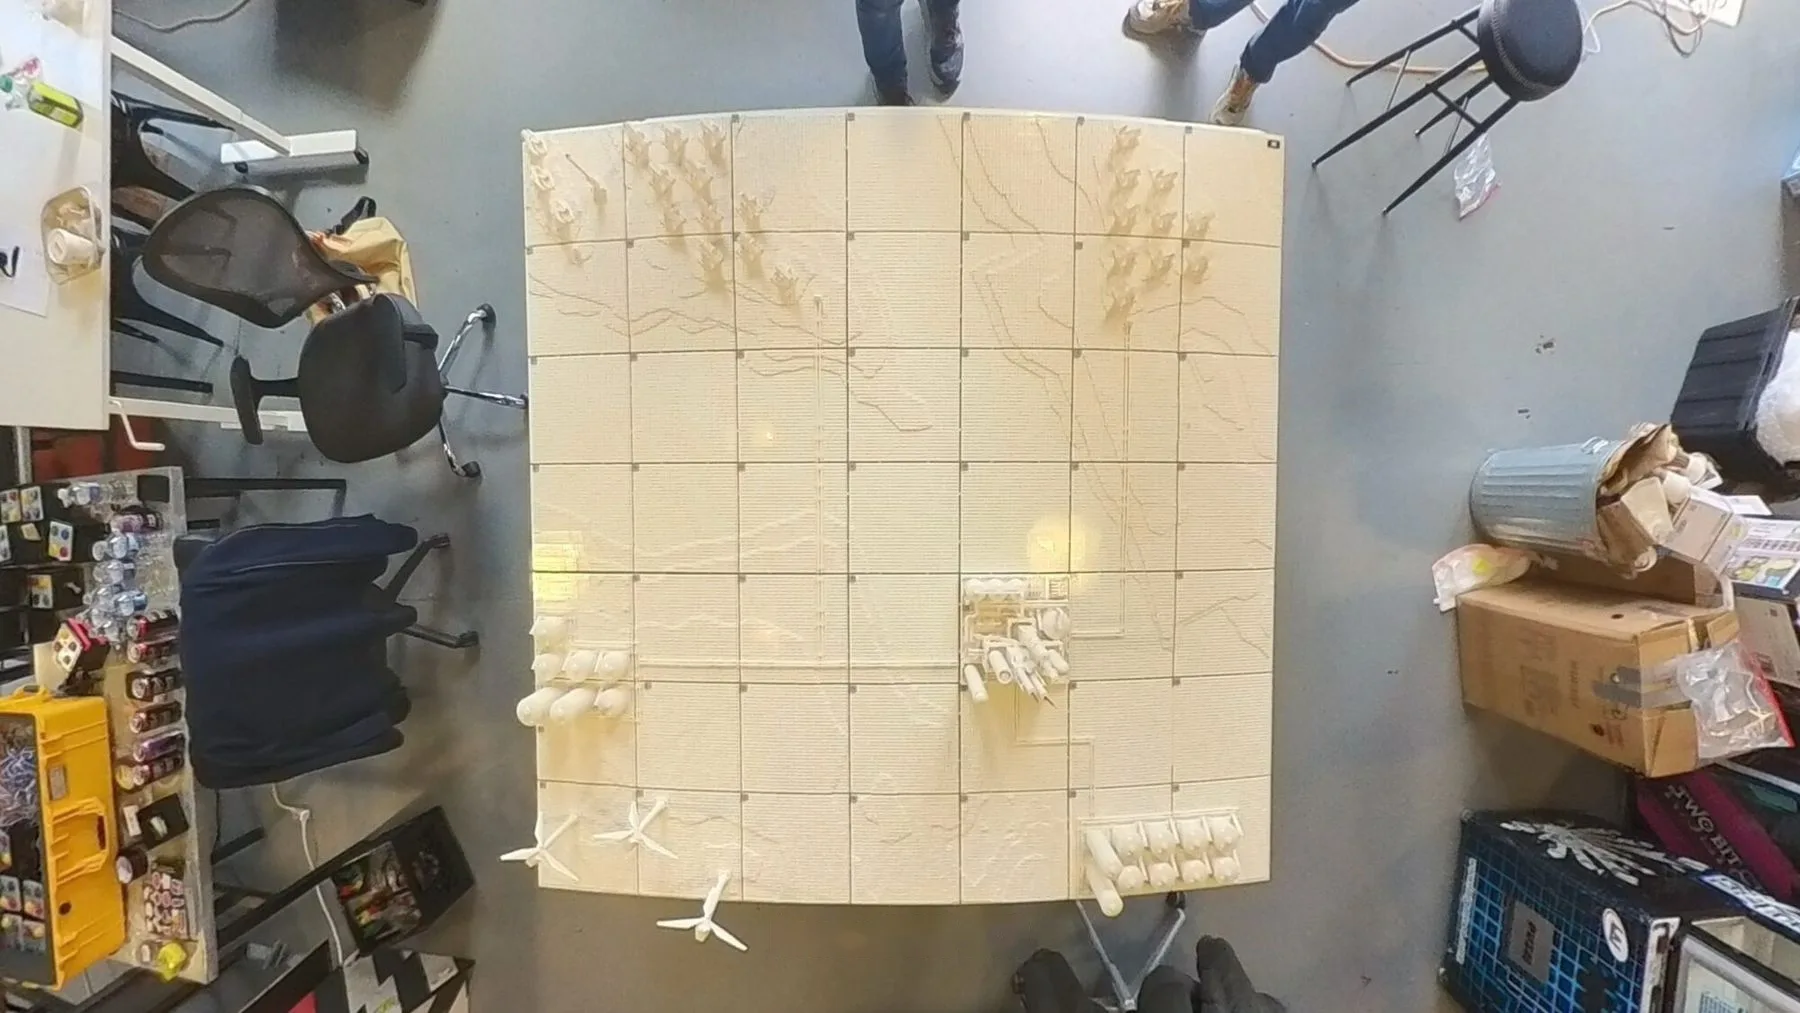
With LEGO builder Bruce Heller of Cornerstone Brick Designs, we built a topographic oil-and-gas landscape entirely in white: pumpjacks, tanks, pipelines, a refinery, wind turbines and a satellite overhead.
White brick turns the whole model into a screen. Projected terrain, color and animation show what no camera can: methane drifting off equipment and across a basin, the way a satellite sees it from orbit.
03 · Three ways to see the data
Each sequence is an illustrated explanation, reviewed with EDF’s scientists, of what a different data product reveals, and what it doesn’t.
The whole region at once: how much methane an entire production basin is releasing.
The diffuse haze from many small sources, the part of the problem that is easiest to miss.
Individual sites releasing large plumes: where a single fix makes a measurable difference.
04 · How it works
Visitors don’t touch the model. An EDF guide taps through bilingual story screens on a custom Unity app, and the table answers instantly, so every conversation lands on the right story.
The tablet is just a remote. Every cue lives in QLab, the show-control software theaters trust, and a wired connection keeps it immune to crowded convention Wi-Fi.
iPad
Custom Unity app
Bilingual story screens
Mac mini
QLab show control
Every cue, plus an idle loop
Projector
Overhead projection
Mapped to the terrain
LEGO table
6 × 6 ft white model
Methane made visible
05 · On the floor in Beijing
06 · Beyond the table
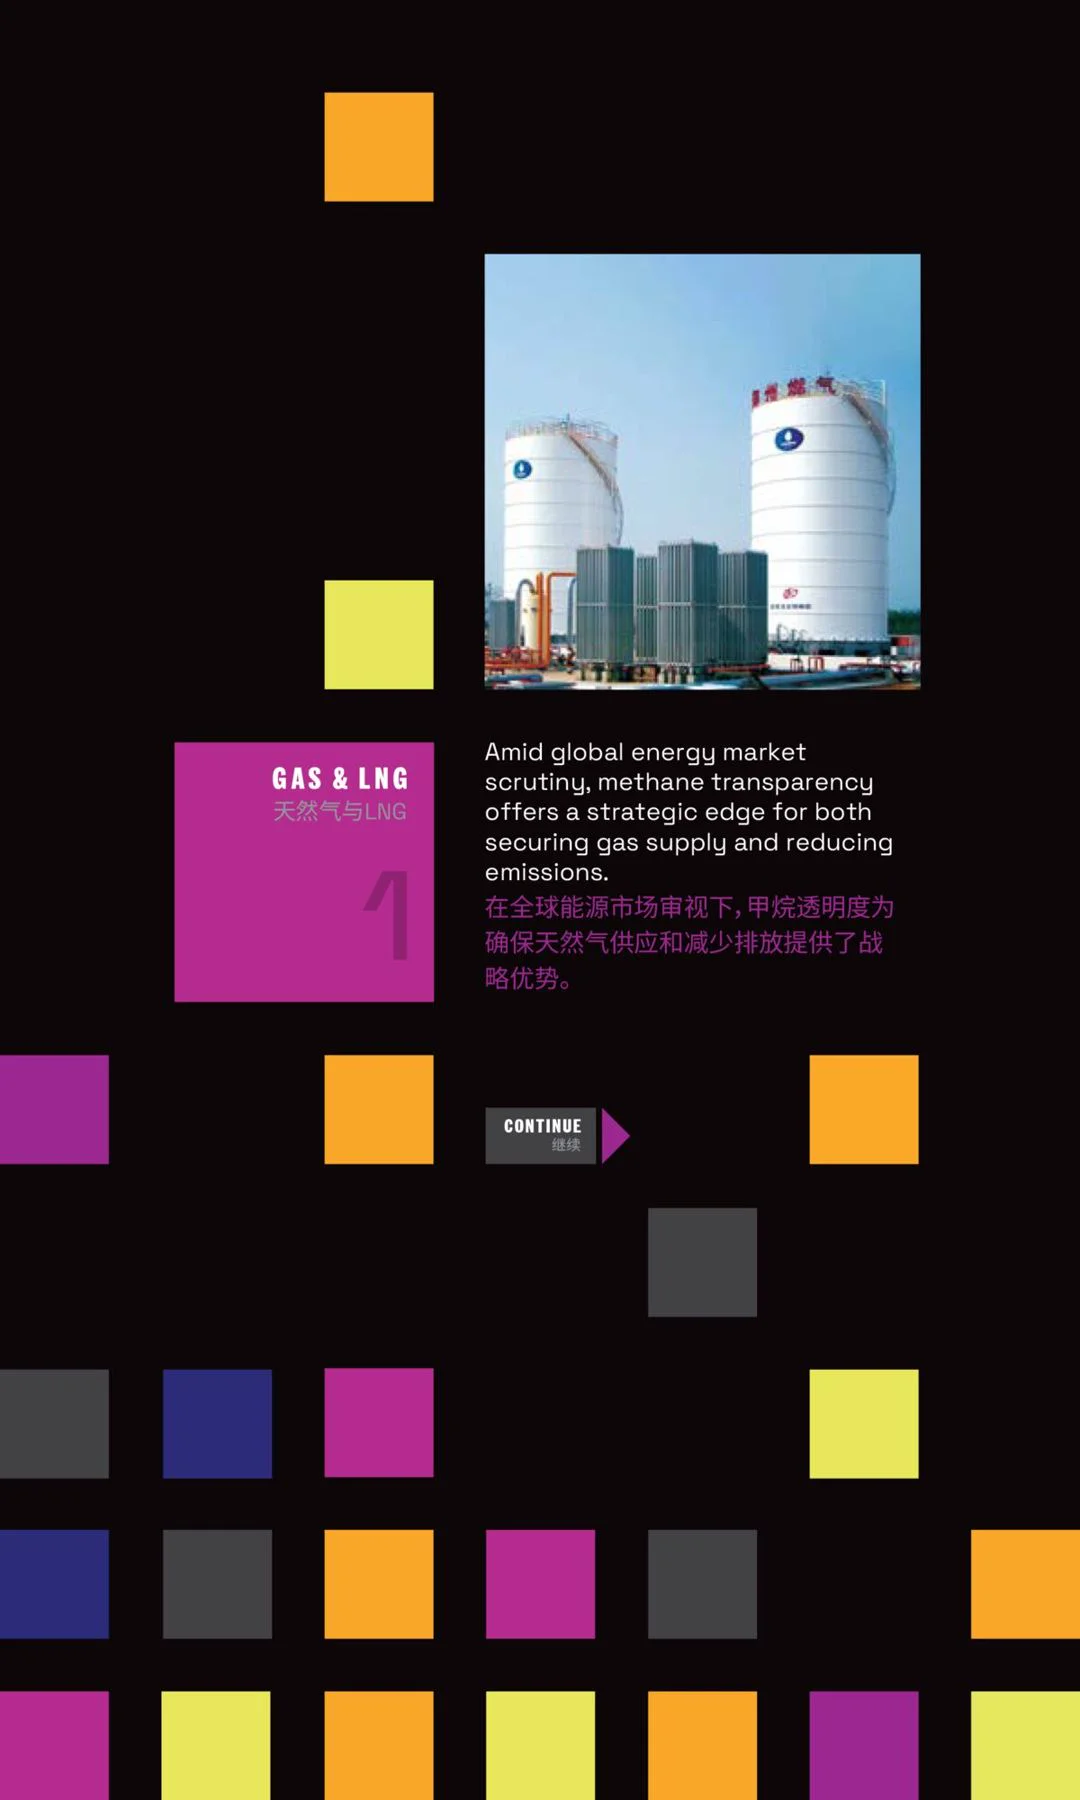
Alongside the table, we built the software for two 65-inch portrait touchscreens telling bilingual “Future Fuels” stories, one on gas and LNG, one on hydrogen, covering methane transparency and supply-chain choices.
The pavilion was a collaboration with Civilization, with booth engineering and fabrication by DesignCentrix.
07 · Built to travel
The landscape was built on Bainbridge Island by a four-person crew, then broken into sections that could fly to Beijing and lock back together on site. Packing was part of the design, not an afterthought.
01
Digital first
Bruce Heller laid out the geography, facilities and scale in BrickLink Studio before a single brick was ordered.
02
Terrain on a grid
Hand-drawn contour maps turned organic terrain into buildable geometry, on a grid the projection could lock to.
03
Modular build
Sections built in parallel, joined with Technic spacers so the seams disappear and the alignment holds.
04
Packed to ship
Every module wrapped and labeled as its own unit, so it arrived in Beijing as a known system, ready to reassemble.
May 2025
World Gas Conference
Premiere in Beijing, shipped and returned intact.
Sept 2025
BrickCon
Shown to the LEGO community at its full 6 × 6 ft footprint.
June 2026
The making-of film
How a brick-built oilfield became a data story.
Next
Your event
Scales from a full pavilion to a single-table reception.
We turn complex science and data into experiences people walk up to, touch and remember. Bring this table to your event, or let’s build the next one.